REVnet is a Windows application I am building for checking a computer's configuration and for diagnosing networks and industrial devices. It combines a local audit, network tools and a Modbus read module. I am building it for technicians, automation engineers and IT people who need to collect results and prepare material for a report. The whole thing is designed to work locally, also without internet access.
The reason is mundane. When chasing a fault, it is easy to end up with several windows, a command result in a terminal and a folder called "test2_final". Then guess what you checked, on which machine, and where that file came from. I want a tool that helps keep this work in order, from the check to the written result.
| Part of the application | What it is for |
|---|---|
| Core Audit | Checking a local Windows computer: account settings, passwords, remote access and more. Results go into findings and a report. |
| Construct | Diagnostic tools, including discovery of devices and ports on the network. A place for a measurement plan, a log and result files. |
| OT Diagnostics | Diagnostics of industrial devices, i.e. OT. The version shown includes the configuration of a register read over Modbus TCP. |
Let's start with an ordinary computer. In Core Audit you choose the areas to check and run the measurement. The screen below already shows findings: the application points out, among other things, no account lockout after failed logins, no automatic screen lock, and the settings of network services. Each entry shows a severity, an area and a level of certainty.
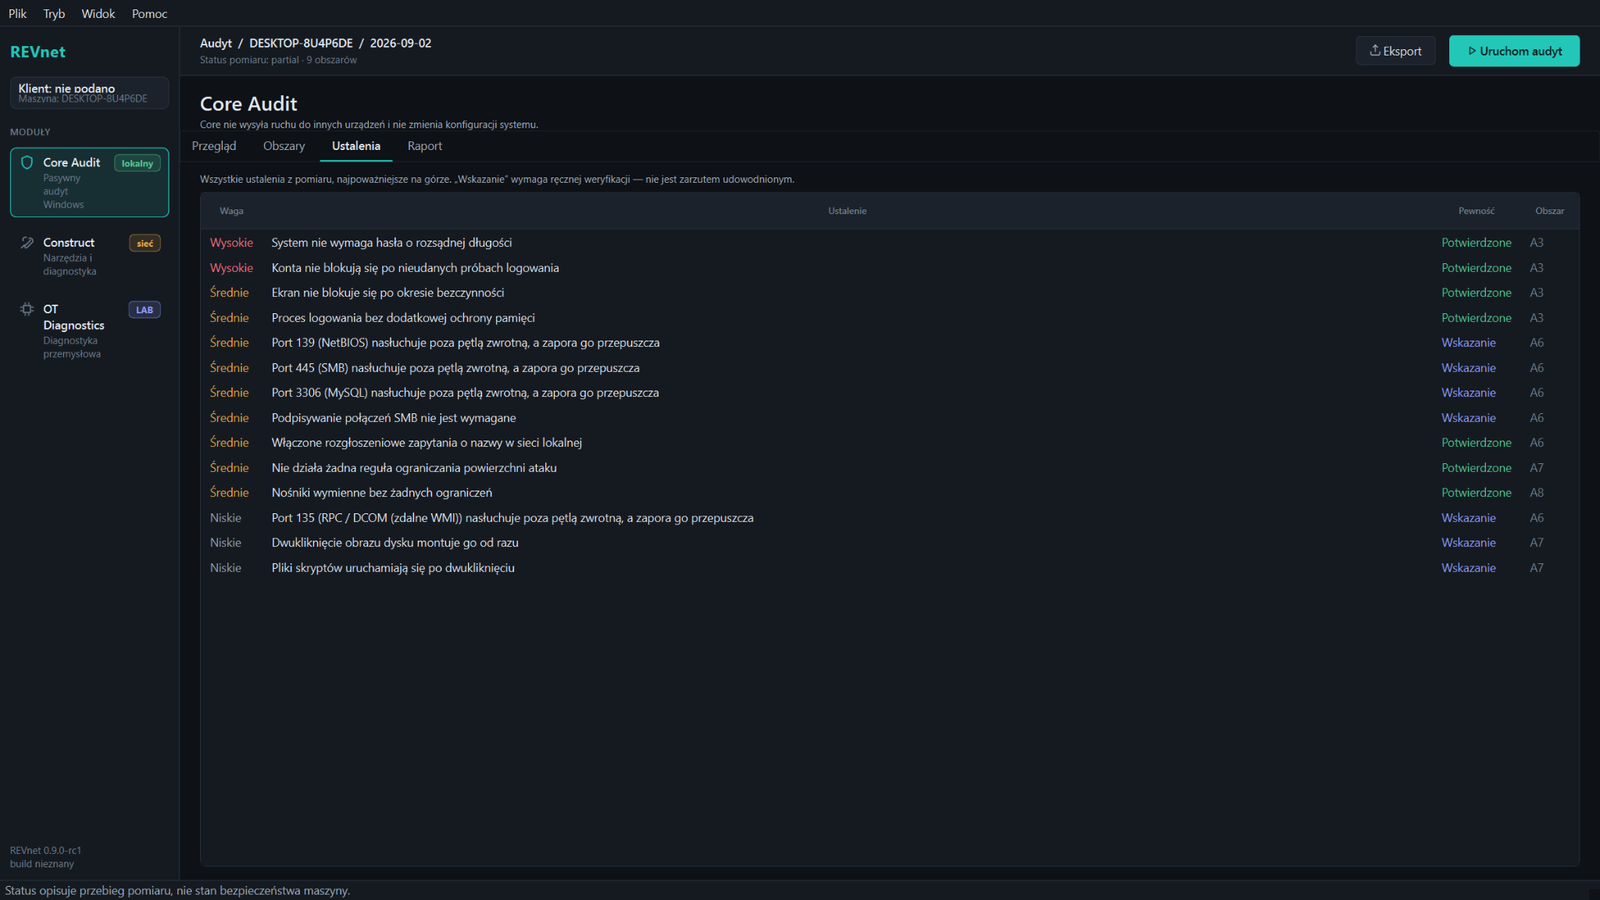
Core Audit — an example list of findings. Each entry has severity and certainty marked separately.
Some entries say "Confirmed", others say "Indication". The distinction matters: an indication requires manual verification. I get a concrete point to check, which I can sit down with for further diagnostics. On this screen the whole measurement also has a partial status — that information has to be kept when the results are written up.
Next comes the report. In the preview shown, the findings go into a document with descriptions and proposed actions. There are also fields to be filled in by the person running the check: client details, author and an overall assessment. The program organises the material, and I add the context: what the computer is used for, what its constraints are, and what can actually be changed on it.
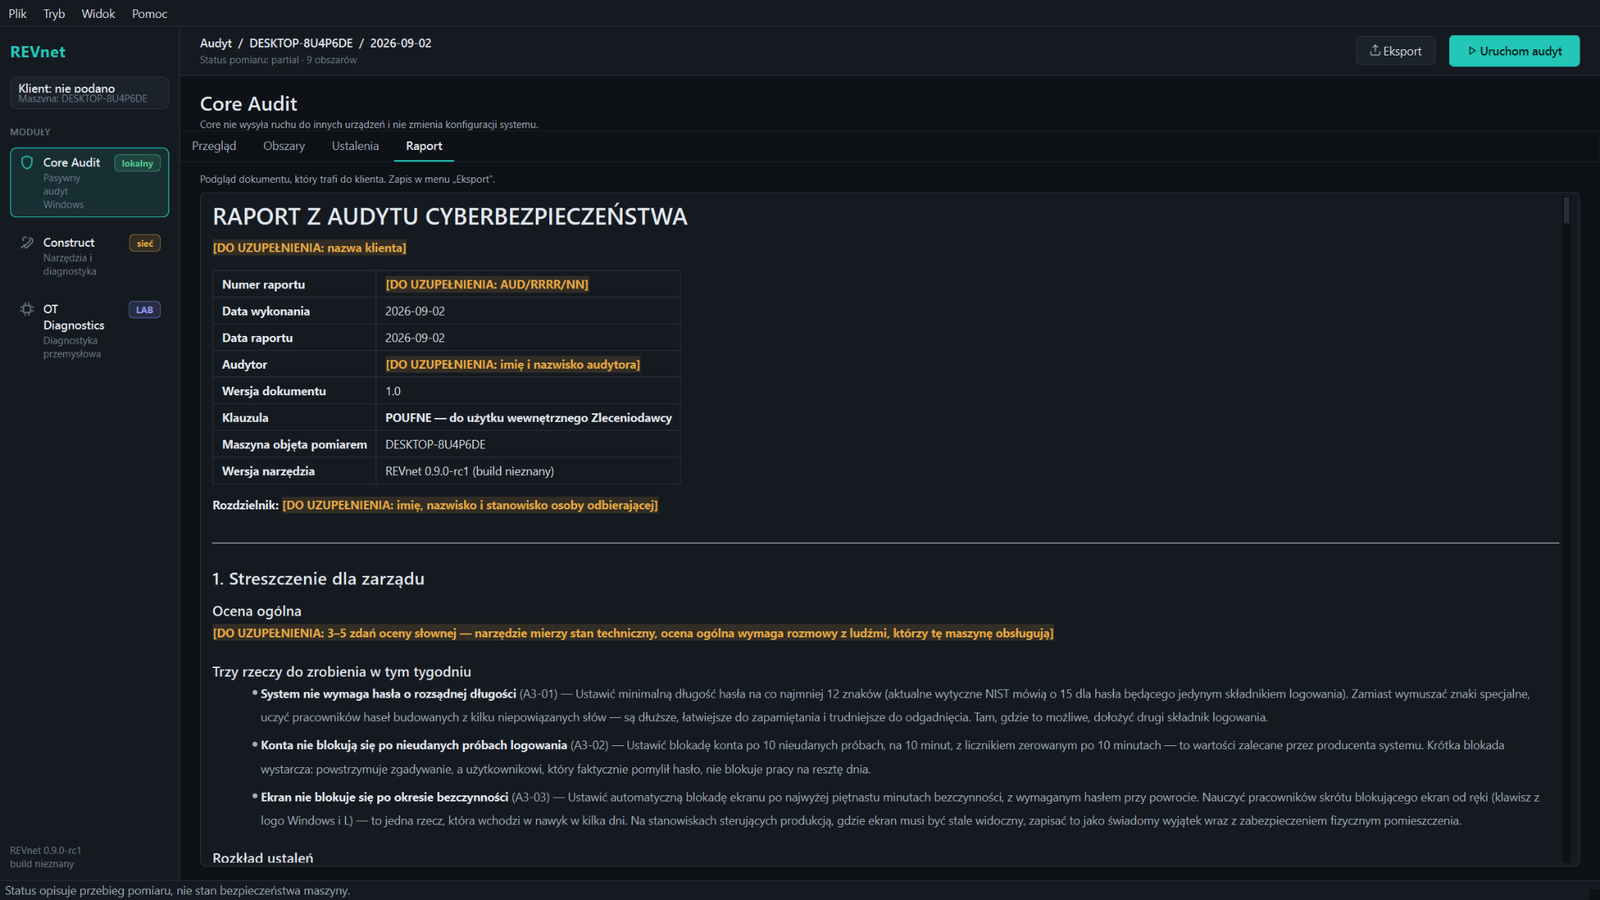
Report — a document preview from an example measurement. Yellow markers show the places that need to be filled in.
With industrial devices a different set of questions appears. Which device am I connecting to? Which registers do I want to read? How many requests should I send? In the OT module these parameters appear in a form: device address, port, Unit ID, register address and count, and a request limit. The screen shown is a Modbus TCP read, function 3.
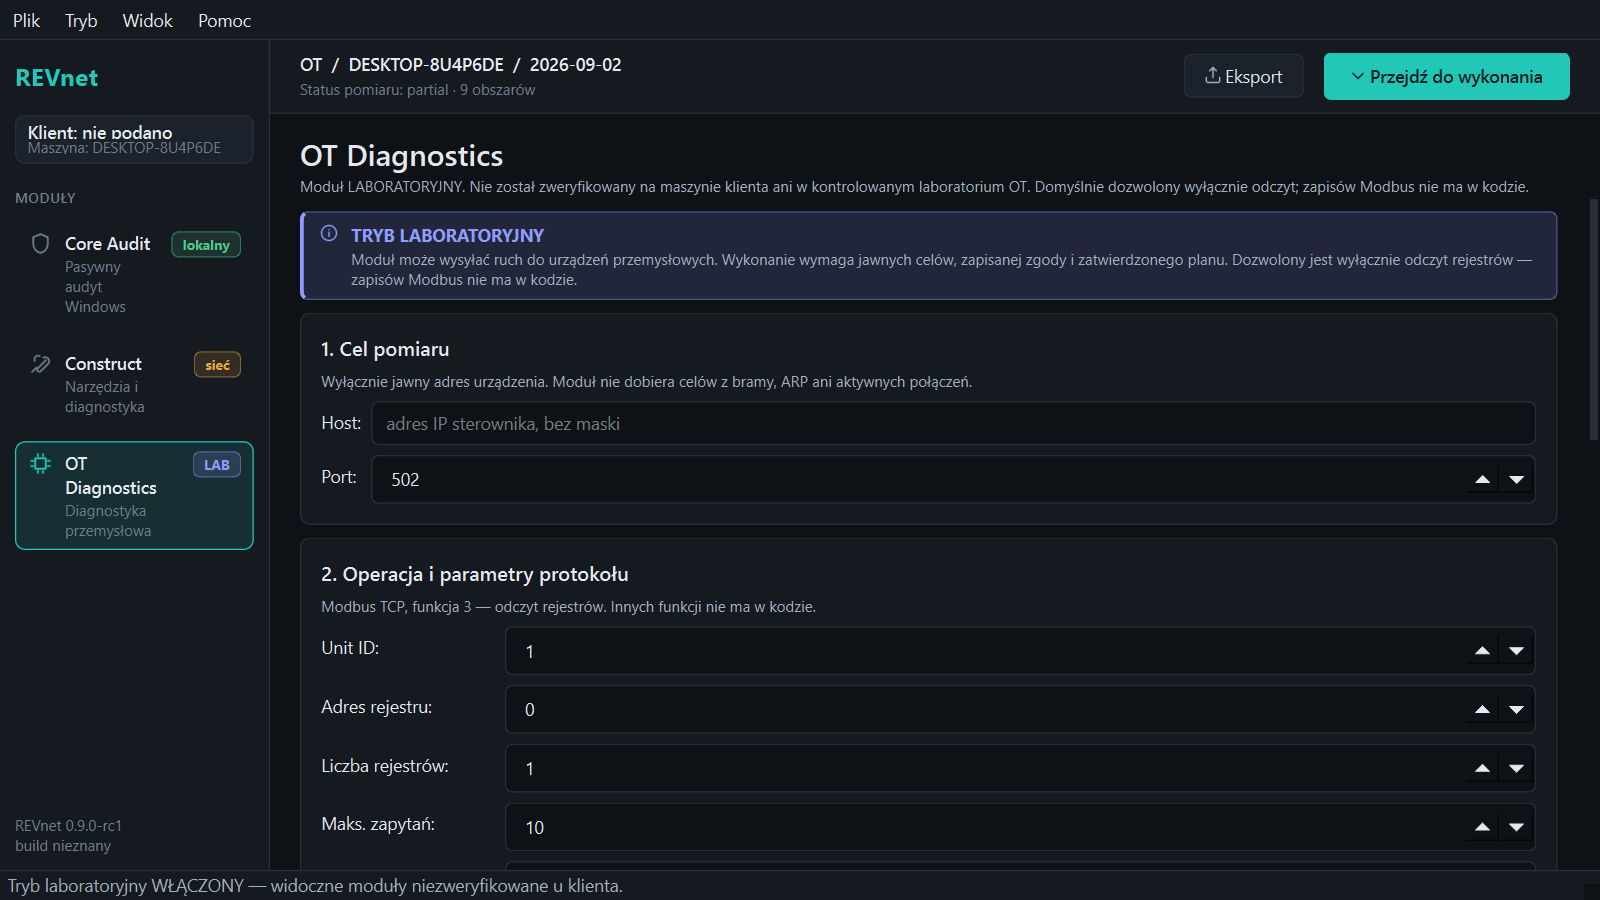
OT Diagnostics — preparing a Modbus TCP read. In the version shown, this module is marked as laboratory.
This is a good starting point for the next, more practical piece: connect a specific device, show its register map, perform a read and explain the values received. Then you can see what the tool actually delivers during real work.
REVnet is still in development. For now I am showing what it is and what working in the application looks like. I want to base the next posts on concrete cases: one question, a measurement taken, a result and a conclusion. That will be the easiest way to judge where REVnet helps and where it still needs work.
The screenshots show a development version, REVnet 0.9.0-rc1, from 2 September 2026. Appearance and scope of functions may change in later versions.